Digital dashboard
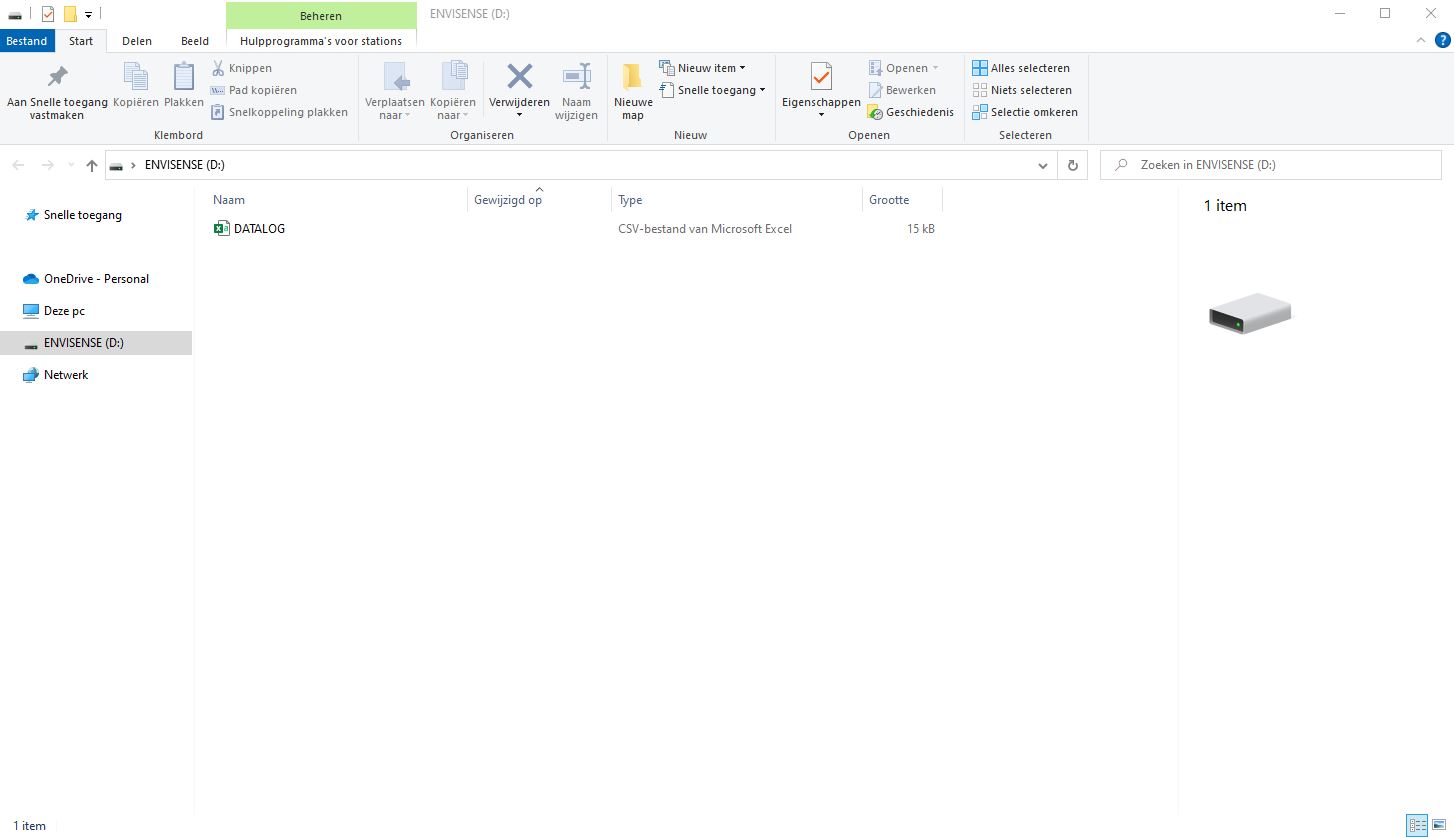
All previously measured data is stored on the EnviSense CO2 monitor and can be viewed in the free digital dashboard. You can connect the monitor to your computer with the supplied USB cable. The folder ‘ENVISENSE’ will open automatically on your computer. This ENVISENSE folder contains a .csv file that can be uploaded to www.dashboard.envisense.net.
Step 1. Go to www.dashboard.envisense.net
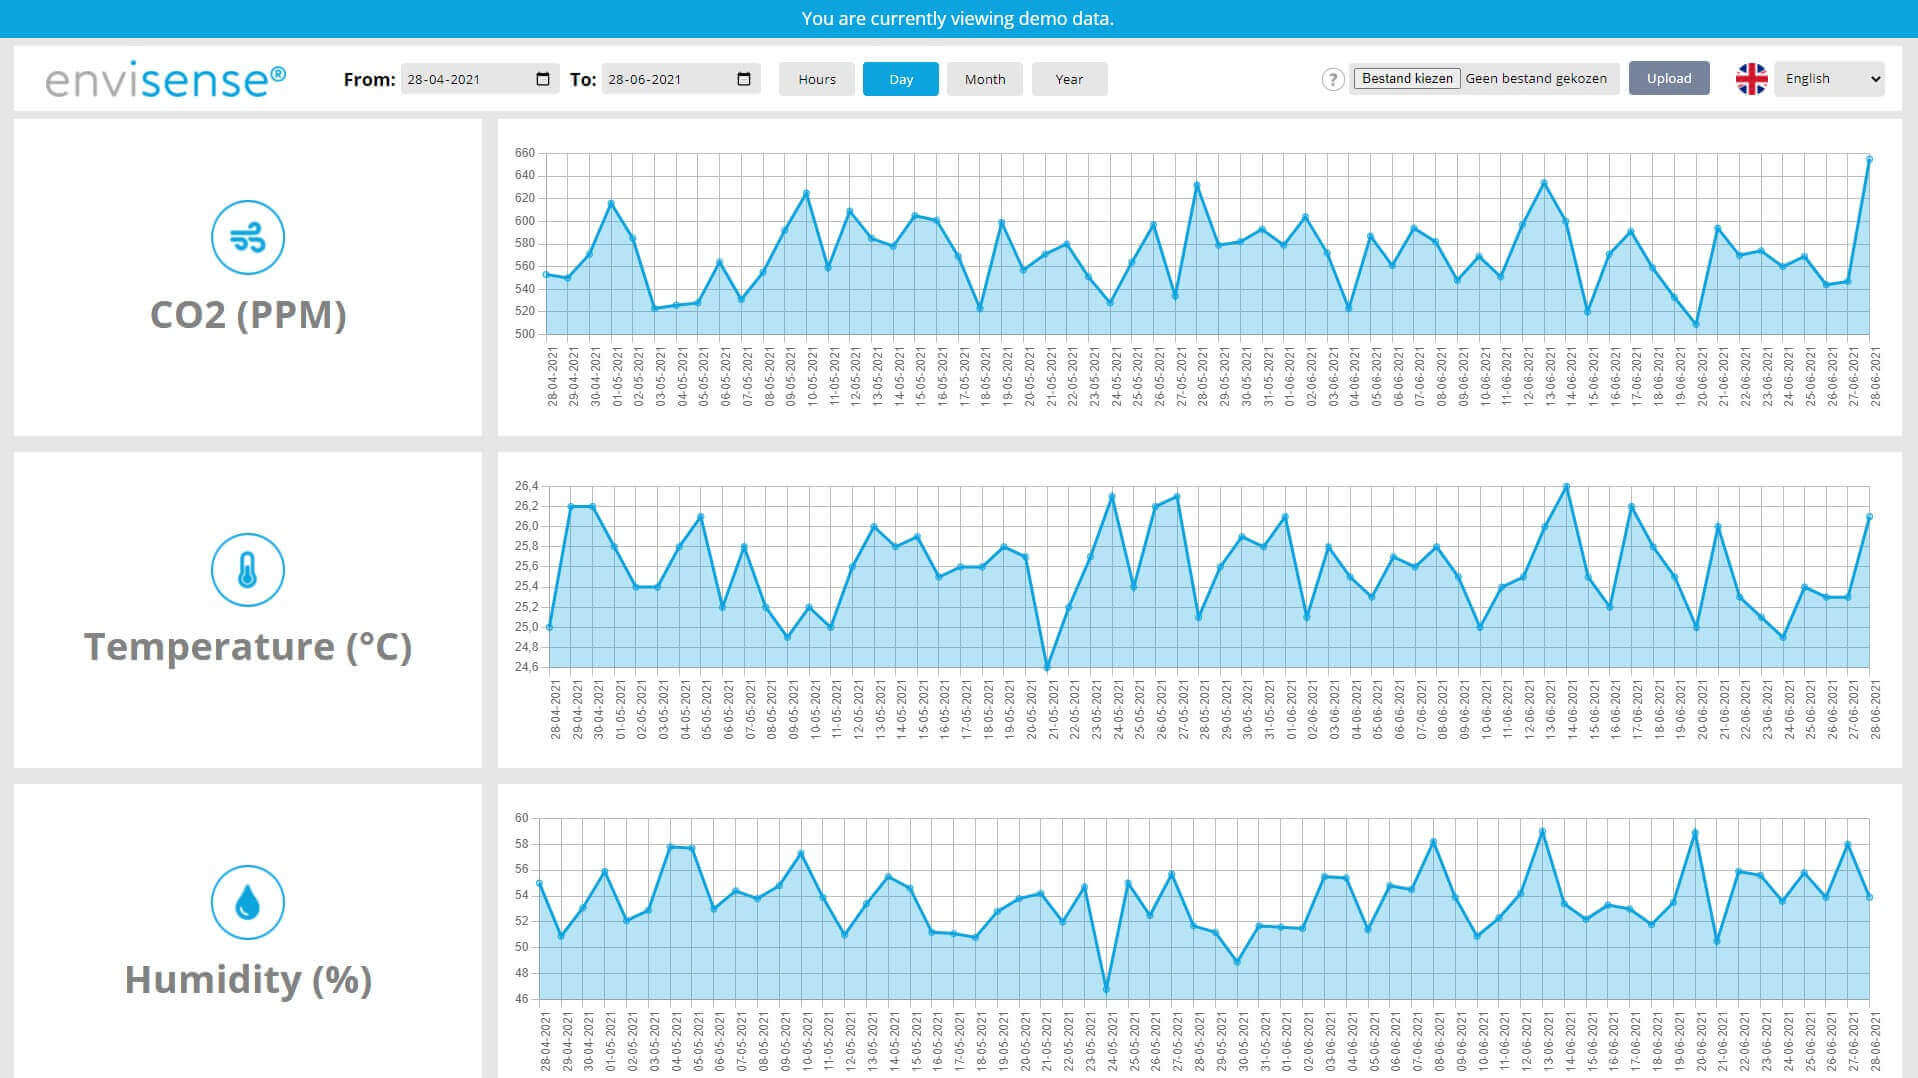
Here you will see a dashboard with graphs of CO2, temperature and humidity. When you open the page for the first time, the dashboard is filled with demo data. Note: this is not your own data yet. In the top right corner you can select your preferred language.
Step 2. Upload your .csv file into the dashboard
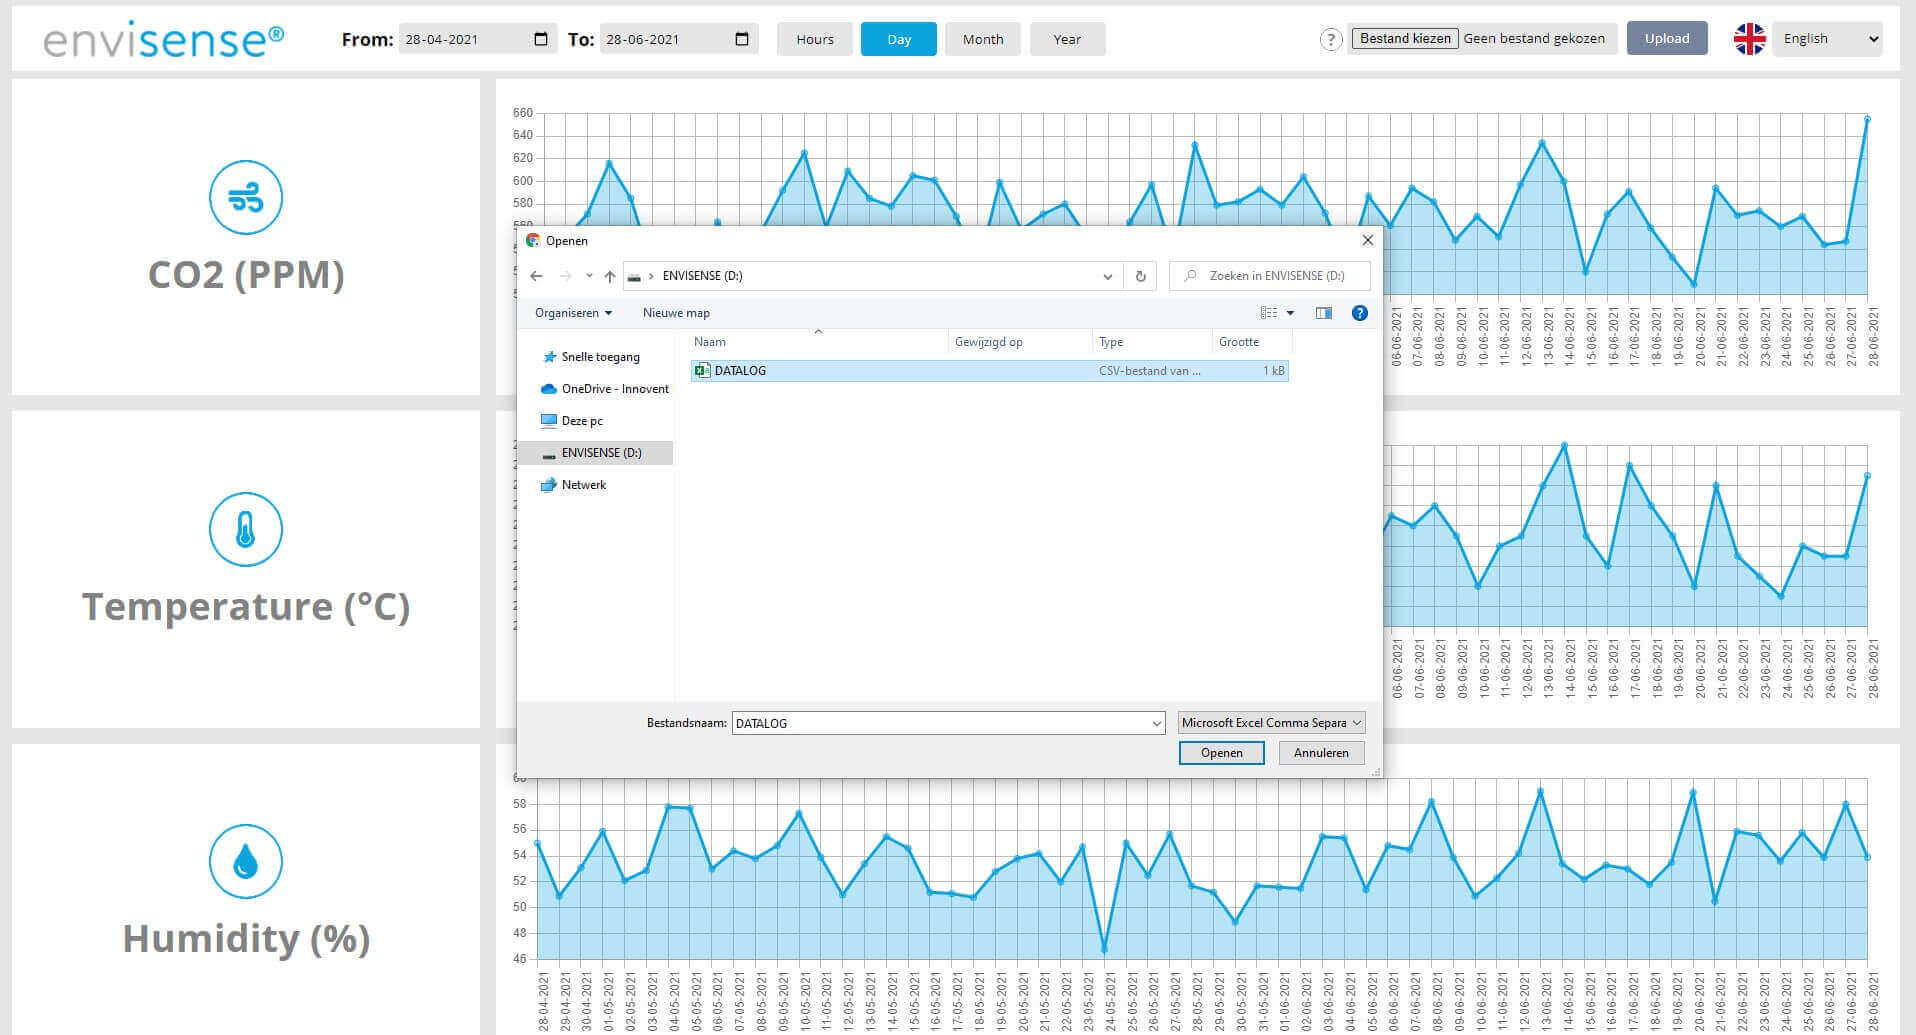
To upload a .csv file, click “Choose file” in the upper right corner. Go to the folder where you saved the .csv file. Select the file and then click the “Upload” button to place the selected file into the dashboard.
Step 3. Overview of historical data
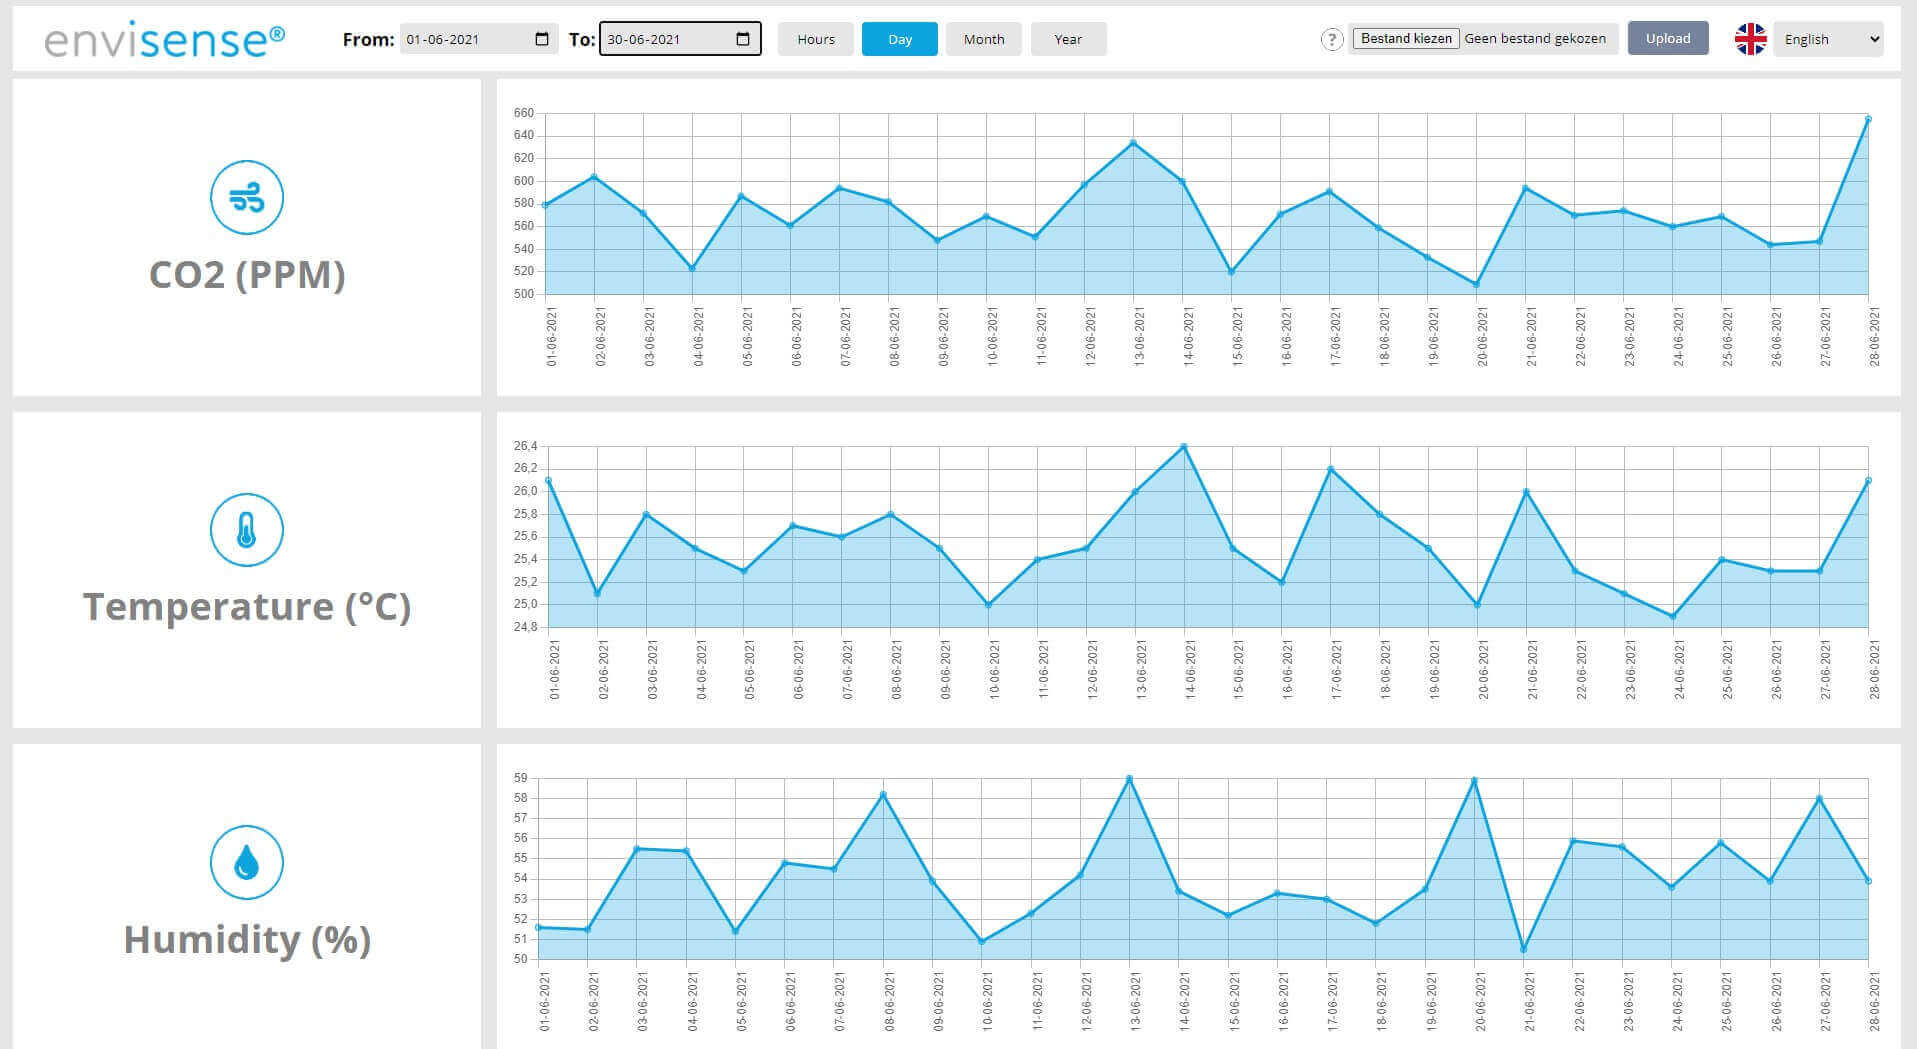
After uploading the file, you will see 3 charts containing your historical data of CO2, temperature and humidity. Top left you can choose the start and end date between which you want to view the data. In addition, you can use the buttons to indicate whether you wish to view the data in hours, days, months or years.
Do you want to erase the data from your EnviSense monitor?
If you want to erase all captured data from your EnviSense monitor you must first connect the monitor to your computer. Next you find the “ENVISENSE” drive and delete the file DATALOG.CSV. All captured data is now erased. The EnviSense will automatically create a new file when you use the monitor again.